Public Domain Image - U.S. National Archives
Introduction: I have always wondered how accurate those WWII dive bombers were. How often did they hit a ship? Could they hit a tank? These kinds of questions led me to perform a careful statistical analysis and to summarise the results in the article below. For general information about dive bombers, I recommend reading Peter Smith’s excellent book Dive Bomber!. What I offer in this article are conclusions based on statistical analysis -- an area not routinely trod by historians; but, I gladly acknowledge the hard work of historians like Peter who made this analysis possible. I would also like to recommend that readers interested in the development and history of dive bombers should read Peter C. Smith's book Dive Bomber!. It is outstanding.
Intended Use of Results: The following analysis conclusions are presented to enable realistic simulation game modelling of WWII dive bomber attacks. A primary effort has been placed on analysing Pacific War dive bomber attacks against ships, but a reasonable effort to characterise interwar British testing of land based dive bombers is also included. Casual use of Gaussian statistics was used for the land based analysis and Weibull Analysis was used for the Pacific War analysis. A comparison of the land vs. naval results indicate roughly the same average accuracy.
The emphasis of this research was to determine ‘where did the bomb fall’, or ‘what percent of bombs dropped during a saturation attack likely struck a ship.’ This research is not intended to determine the destructive effects of such bomb drops. A few comments on the subject are presented in Appendix B.
Credits: Use of the models presented herein are allowed (without payment) provided credit is provided in introductory/lead-in material for games along with a link to www.dionysus.biz. Credit should be styled as per Appendix C Credits, or as authorised by me at paul-watson@sbcglobal.net
I wish to acknowledge the scholarship and readability of the very interesting book by Peter Smith entitled Dive Bomber!. Peter’s book provided both broad understanding of the subject and also provided most of the historical data concerning interwar testing and numerous instances of attack success against shipping in the Pacific. See Sources for this and other sources that served as a basis for this article.
Method of Analysis: Both Gaussian statistics and Weibull Analysis were used in preparing the following summary conclusions. The conclusions presented herein are based on sound technical methods of analysis used in science and industry. I may, at a later date present a detailed article on how I analyzed dive bomber accuracy. I might add that this paper proved to be a rather tedious undertaking which is the reason I am not jumping into a technical explanation. The conclusions presented herein are about as thorough and accurate as can be made looking through the gloom of time to events almost a century ago.
Early British Dive Bomber History (1918 to 1940): Numerous WWI land based attacks were carried out with bomb release during a dive. Such attacks seemed more accurate than level bombing attacks. By 1918, the British were conducting land based tests on dive bombing methods. Stationary target accuracy tests were performed using five pilots and SE5A aircraft. The primary experimental variable was bomb release height. See Table 1 for results. (1)
Between 1918 and 1938, numerous additional experiments were conducted but data correlation between experiments was difficult because no standard dive bombing doctrine existed which would have facilitated orderly test deviation from ‘controlled conditions’. Two studies that do seem to offer similar data are presented in Table 1 below. Both tests, examined dependency of target error on release altitude. (1)
| Date | Aircraft | Trial No. | Release ft. | Avg.Err.ft. | Source |
| 1918 Orfordness | Brit SE5a | 1 | 300 | 12 | Smith Table 1 |
| ditto | 2 | 300 | 11 | ||
| ditto | 3 | 400 | 12 | ||
| ditto | 4 | 450 | 15 | ||
| ditto | 5 | 500 | 22 | ||
| ditto | 8 | 550 | 19 | ||
| 1937-1938 | Hawker Hinds | 1000 | 105 | Smith Table 14 | |
| ditto | 2000 | 162 | |||
| ditto | 3000 | 146 | |||
Information from Table 1 can be reduced to a graph showing the effect of bomb release altitude on radial error (i.e. distance from center of target in feet). See Figure 1 below:
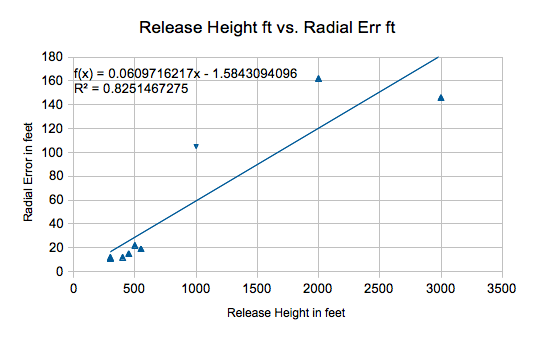
Figure 1 demonstrates that lower altitude bomb releases results in less target error. If this trend is reduced to a straight line, it would be the blue line shown in Figure 1. For programmers, it is useful to describe the blue line by Equation 1 below.
We might summarise Equation 1 by saying that the typical (I believe average) bomb distance from center of target is about 6% of bomb release altitude. Thus, lower drop height means greater accuracy! It also means greater risk from anti aircraft fire, and ground impact.
Method of Analysis- British Land Based Dive Bomber Accuracy: Statistical analysis always assumes something about the underlying data. In general, we prefer to analyse data belonging to a single population. For Dive Bombers, we can assume differences exist in pilot training and aircraft between British, Americans, Japanese, Germans, Italians etc.. Naval pilot training likely differs from army air corps training. We should thus be cautious in assuming similar methods and results across organisational boundaries.
Conclusions for British Land Based & Comparison to Navy & German: Clear answers about dive bomber accuracy become entangled with the attack doctrine of various services. My analysis assumes the following for all WWII dive bombers:
| Avg.Rad.Err.ft. | Std.Dev.ft. | Source | Comments | |
| British Land Based | 90 | 133 | Figure 1 | 1 |
| German JU87 Stuka | 200 | 300 | Internet Forum & Source 6 | 2 |
| German JU88 | 150 | 222 | Internet Forum | 2 |
| US Navy SBD | 109 | 156 | Gaussian Analysis | 3 |
| Japan Navy Val 42 | 92 | 136 | Gaussian Analysis | 3 |
Table 2 provides a comparison of British, German (unreferenced data from Internet forum), Japanese Navy, and US Navy based on Watson Gaussian Analysis. A discussion explaining the significance of the data follows the table. The U.S. Navy Avg.Rad.Err.ft value has been worked out here is the example.. The www.dionysus.biz home page also has an introductory statistics course available for free, on line. Go to www.dionysus.biz and follow the link to St Pauls Introduction to Statistics if interested.
Comments:
Discussion of Table 2: Naval records make clear that dive bomber hit percentages were highly variable from one mission to the next. Some missions simply missed the target, while others achieved 50% hits. This variability was likely typical for land based dive bombers as well. During WWII, there was no “standard hit percentage” that could be counted on; but long term averages can be established and we can characterise the variability between missions.
The average radial error in feet describes how many feet away from the centre of a target a bomb typically fell (with some falling closer and some farther away). The radial error numbers of Table 2 generally indicate dive bombers could hit, on average within 100 feet of their target.
The Standard Deviation provided in Table 2 characterises how variable mission results were. Mathematicians interested analysing WWII dive bomber attacks will need the averages and the standard deviation (both are provided in Table 2). This will allow calculation of the likelihood of a bomb hitting at approximate distances from the target.
Analysis of WWII Naval Dive-bomber accuracy: Some discussion of both U.S. and Japanese naval dive bomber accuracy has already been presented. The following section provides more complete information including:
Realistic Simulation Games strive to provide ‘game players’ with a realistic simulation of the ‘ups and downs’ of the historical experience, minus the bloodshed. Dive bomber performance is made up of two statistical components: How accurate are the bombs? (i.e. What percentage are likely to hit a target ship?) And what is the mission to mission variation that can be expected?
Interwar US Navy Dive Bomber Research: October 1926, LCDR Frank Wagner carried out a mock attack on U.S. Pacific Fleet ships. Although the ships were notified in advance, Wagner's dive from 12000 feet caught the fleet with “guns unmanned”. (Ref Globe Security.Org. Author not identified. See also Smith).
Wagner later demonstrated dive bomber accuracy tests scoring 19 hits out of 45 bombs aimed at a 100'x45' target. (Ref Globe Security.Org). Note: if target short axis is assumed to dominate targeting errors and data is analyzed by Standard Normal Distribution, this would indicate a Standard Deviation of 36.8 feet.
Circa 1928: Lieutenant Commander Leighton gave a lecture at the Naval War College & indicated the following (See Smith, ‘DiveBomber!’):
In the Late 1930's, Captain McGee U.S.M.C. issued an ACTS Research Paper that summarised standard U.S. Naval tactics.
| Type of Target | Level Bombing % Hits | Dive Bombing % Hits |
| Battleship (direct hit) | 13% | 40% |
| Battleship (within 30 feet) | 23% | 53% |
| Heavy Cruiser at Speed | 4.24% | 18.6% |
| Destroyers at Speed | 1.4% | 7.8% |
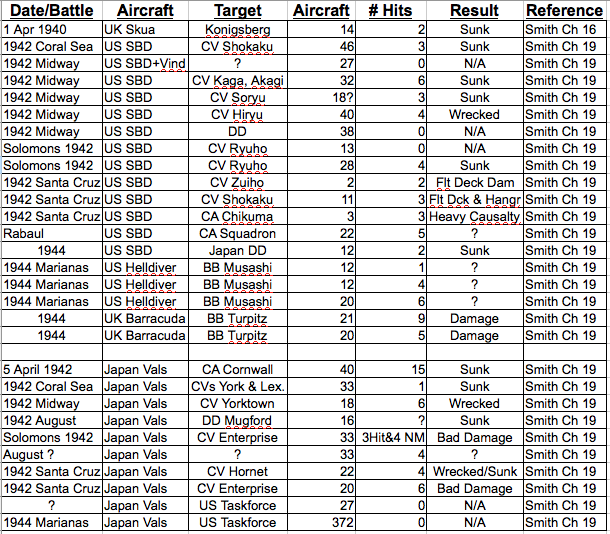
WWII Pacific Dive Bomber Attacks: Experience & Interpretations: Analyses of wartime data indicates McGee's dive-bomber hit percentages were about right for cruisers, but optimistic regarding battleship hits. For level bombing, McGee’s information is unrealistically optimistic. (History records a single instance of a ship (destroyer) hit by level bombing). The following pages present a statistical analysis of WWII combat data extracted from Peter Smith's book. The statistical analysis resulted in two equations (one for US/UK and a second for Japan) that describe mission to mission success variability. These have been reduced to “dice hit tables” as a simple way of conveying the conclusions. Game developers may prefer to use random number generators and equations. An example of these methods is also presented.
Method of Analysis: The very powerful Weibull Statistics method was used to characterise variability in mission strike effectiveness. This article presents results, rather than method; but a brief summary seems appropriate. Weibull Analysis is performed as follows:
Because the focus of this article is computer simulation games, I will leverage off the history of such games and their use of dice. I will present the statistical conclusions regarding mission variability as a “percent hit table” that correlates to a dice role. Data will be presented for 6 sided dice, equivalent data for 12 sided dice and equivalent data for 20 sided dice. The approach for game programmers using random number generators and equations is also presented below.
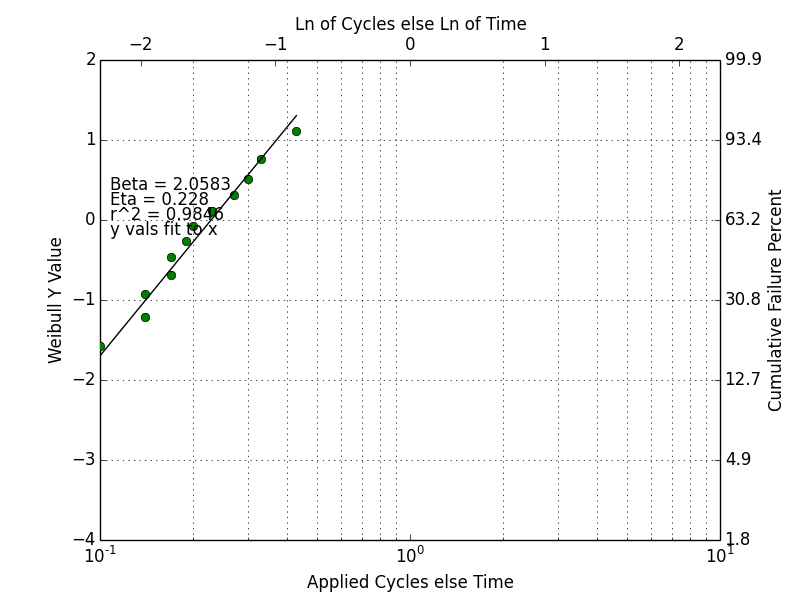
Figure 2 above is a Weibull plot based on 12 US Dive-bomber saturation attacks and their corresponding percent hits. The bottom and right axes are important (ignore top & left axes). The Weibull analysis program is currently under development and updates will allow me to label the x axis as “Mission Percent Hits”. A similar Weibull plot was prepared for Japanese air strikes.
Two things are important about Figure 2. First, the data points fall very close to a straight line. That means that Weibull will accurately model the data. Second, the Beta and Eta values shown at top left are used to write the Weibull equations that can be plugged into a spreadsheet and mined to determine how a dice role should correspond to percent hits achieved during an attack. These methods realistically describe both the percent hits and the “ups and downs” experience of a naval commander.
Dice Hit Tables from Weibull Analysis:The following dice hit tables were created from Weibull results of separate analyses for Japanese and U.S. attack data. A possible future article may explain the analysis method. The results are presented below for whatever dice you may wish to use.
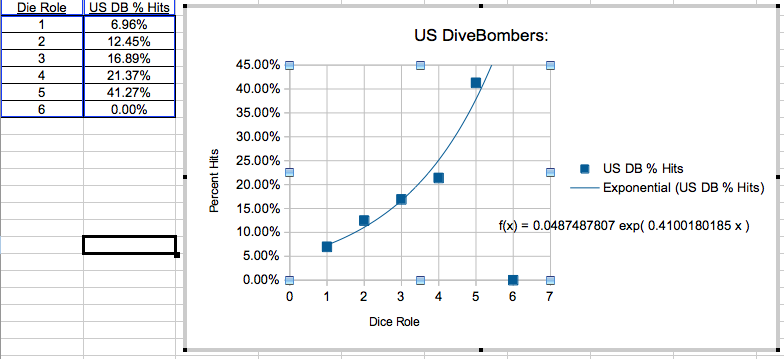
| Die Role | US Dive Bomber Hits | Japan Dive Bomber Hits |
| 1 | 6.96% | 3.08% |
| 2 | 12.45% | 8.46% |
| 3 | 16.89% | 14.41% |
| 4 | 21.37% | 21.71% |
| 5 | 41.27% | 53.20% |
| 6 | 0.00% | 12.43% |
| Die Role | US Dive Bomber Hits | Japan Dive Bomber Hits |
| 1 | 4.92% | 1.68% |
| 2 | 8.57% | 4.43% |
| 3 | 11.25% | 7.10% |
| 4 | 13.59% | 8.97% |
| 5 | 15.80% | 12.83% |
| 6 | 17.98% | 16.07% |
| 7 | 20.21% | 19.70% |
| 8 | 22.59% | 23.91% |
| 9 | 25.23% | 28.99% |
| 10 | 28.37% | 35.56% |
| 11 | 26.16% | 45.14% |
| 12 | 0.00% | 19.02% |
| Die Role | US Dive Bomber Hits | Japan Dive Bomber Hits |
| 1 | 3.82% | 1.08% |
| 2 | 6.60% | 2.81% |
| 3 | 8.57% | 4.43% |
| 4 | 10.24% | 6.03% |
| 5 | 11.74% | 7.65% |
| 6 | 13.14% | 9.31% |
| 7 | 14.48% | 11.03% |
| 8 | 15.80% | 12.83% |
| 9 | 17.10% | 14.73% |
| 10 | 18.42% | 16.76% |
| 11 | 19.75% | 18.93% |
| 12 | 21.14% | 21.30% |
| 13 | 22.59% | 23.91% |
| 14 | 24.13% | 26.82% |
| 15 | 25.81% | 30.16% |
| 16 | 27.69% | 34.08% |
| 17 | 29.86% | 38.88% |
| 18 | 32.54% | 45.14% |
| 19 | 0.00% | 34.40% |
| 20 | 0.00% | 0.00% |
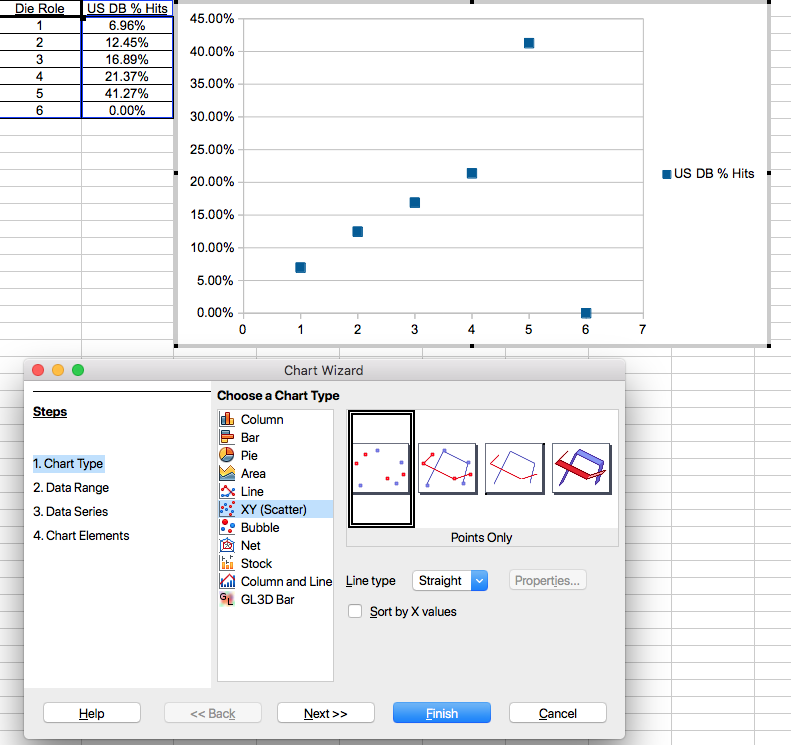
Converting Dice Tables to Usable Equations for Computers: It is not difficult to reduce one of these tables to an equivalent equation form (You will need 1 equation for US and a second equation for Japanese). For simplicity, I used U.S. data from Table 4 to create an example. See also Figures 3 & 4 below:
Program Function or Subroutine: The game programmer can use code something like this in function or subroutine call (pseudo code follows):
	DefFunction USHitPercent
	DieRole=Random(Int(6))
	If DieRole>5:
              HitPrcnt=0.00
	Else: HitPrcnt=.04875*(2.71828^(.410018*DieRole) #REM Equation copied from Figure 4 trend-line
	Return HitPrcnt
It is worth noting that Japanese data from the table should be fitted to its own equation. Then Japanese attacks would reference their function call, and US would reference their own function call. From UK Skua data for attack on German cruiser in Norway appears to support use of US tables/equation for UK Skua dive bombers. Detailed data for German, Italian etc. forces has not been located.
Width Correction Factor: The percent hit tables above are based on typical size of a ship. For game modellers, a linear correction factor is recommended as follows:
Conclusions: Mathematical and statistical analysis has been used to accurately describe WWII dive bomber performance. The following information has been provided:
Sources
Appendix A: Dive Bomber Saturation Attack Data extracted from Peter C. Smith Dive Bomber!
Appendix B: Weapon Effectiveness:
The purpose of this article was to characterise weapon accuracy, and not the destructive effects of those weapons. But I have chosen to make a few relevant comments. Because dive bombers were accurate, they were typically used during WWII for the following:
Attacks in open country often cause no real damage if the primary target is missed. Attacks on ships are different. Every square foot of a ship has a purpose — either combat or operationally related. Even operationally related damage often proved fatal (e.g. oil leaking from Bismarck, operational damage to Graf Spee ). For ships, it is largely a matter of ‘hit’ or ‘miss’ although very near misses can cause damage.
WWII Aircraft carriers carried large quantities of bombs, torpedoes and aviation fuel. They were lightly armoured. Three to six bombs usually proved fatal. Merchant ships and destroyers were usually destroyed by a single high explosive bomb. Even heavy cruisers suffered substantial damage from dive bomber attack.
Perhaps the best way to research historical effects of dive-bomber attacks is to review Peter Smith’s book and study various tables that document number of bomb hits and resultant damage. For ships, books such as those by Garzke, Friedman, John Campbell, J.N. Westwood et. al. have detailed descriptions of battle damage for battleships, cruisers, aircraft carriers and destroyers. Information on gunfire damage is often relevant as bombs and shells are simply alternative ways of delivering a weapon.
Appendix C: Authorised Use of This Data & Models:
Free use (without payment) of models and information contained in this article is allowed for game development (whether commercial or not), school or scholarly research PROVIDED this article is referenced and a link to www.dionysus.biz is provided. For printed material, provide the web address in lieu of link. The required format is:
	Information/models used with permission. see www.dionysus.biz  article
	entitled “Modelling WWII Dive Bombers” Copyright 2020 by Paul F. Watson.
Up to 30% of the text may be used in an article, but should be footnoted. If you have a use different what what is described above, please e-mail paul-watson@sbcglobal.net briefly describing your application and requesting permission. I am very likely to approve any reasonable request.
Contact the author
paul-watson@sbcglobal.net
by e-mail.
© 2020 (1 January 2020)
All Rights Reserved
Paul F. Watson