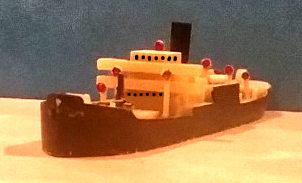
Typical WWII Cargo Ship
Analysis of Dive Bomber Attacks Against Ships
Gauss Distribution Based Analysis
by Paul F. Watson, January 2020
Introduction: When a WWII dive bomber aimed at a target, how far away did the bomb typically fall? Is it possible to determine the average 'radial miss' distance from the percent hits during WWII ship attacks? The article below is a bit technical, but works out an example showing exactly how this kind of historical research can be done. The resulting conclusions extend our understanding of history and facilitate development of computer based historical simulation games.
A Gaussian statistical analysis can often be assumed (if we have no better information) to describe diverse phenomina. In the following article, a historian uses this approach to analyze the accuracy of WWII bombs because he wants to unify his understanding of land vs. sea attacks. He wishes to develop technically based comparisons of attack accuracy for U.S., German, Japanese and British planes. This article demonstrates that percent hits against ships can be 'leveraged' into average miss distance during dive bomber attacks and shows you how to perform such an analysis.
The Problem: The historian has information on the percentage of hits achieved on ships during dive bomber attacks. He also knows how wide the ships were. Because the ships were much longer than wide, he assumes most of the misses occured when bombs fell off to the sides of the ship under attack.
He would like to determine the average "miss distance" in feet for U.S. Navy dive bombers and the exact same method will work to better understand Japanese wartime achievements.

Front View of Cargo Ship Under Attack
Figure 1
What he knows from history: The researcher has already determined that U.S. dive bomber pilots hit enemy ships with about 16% of their bombs.
He also knows that the typical target was about 63 feet wide (beam of the ship). Some ships were wider and some more narrow; but, 63 feet is a good approximation.
Analysis Approach:
The following chain of reasoning are 'echos' of the historian's thoughts :
- "If I can approximate the Probability Density Function (PDF) of the bombs. Then I can probably 'mine out' most of the information I want. I will concentrate on the PDF."
- "In WWII, military pilots were well trained. It is a good guess that as many bombs went left of the target vs. right of the target. If the PDF describes where the bombs fall, then left side and right side of the PDF must be mirror images -- i.e. the PDF must be symetric."
- "I don't know what the PDF looks like, but I do know about the Gaussian distribution. It is symetric and works for many different things. I'll use it and see if my answers look reasonable."
- "The center of the Gaussian PDF will be centered on the ship's mid-line. This assumption is because of number 2 above."
- "Target ships were about 63 feet wide. (From history, that is the size of a medium ship like a heavy cruiser.)"
- "US dive bombers hit with about 16% of their bombs. (see Peter Smith, Dive Bomber! published in 1981)"
- "I can put all these ideas together with a sketch like Figure 2 below:"
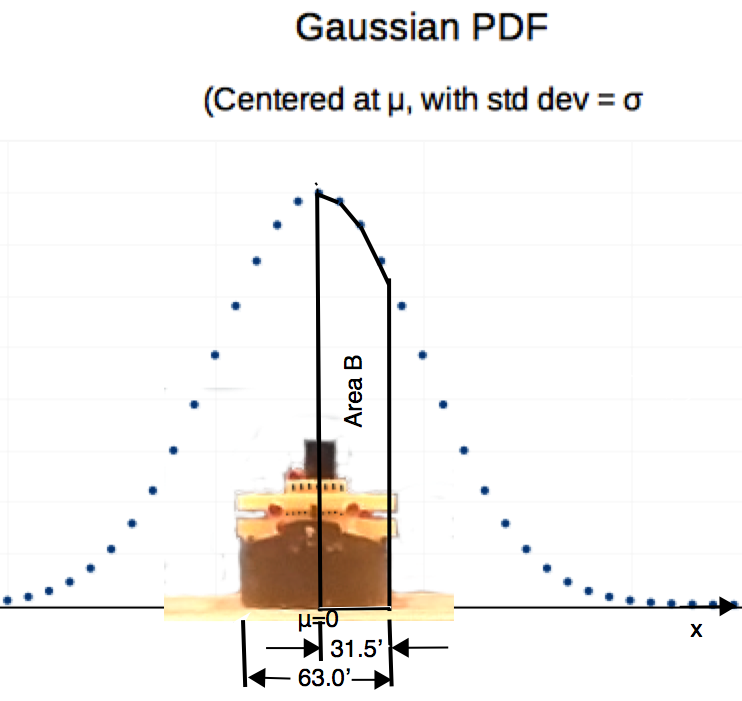
Gauss PDF Overlay on Ship
Figure 2
Analysis: More Thought Echos from the Historian:
- "Total percent of hits is 16%. That means 8% on right of ship & 8% on left of ship."
- "Area B of Figure 2 must be 8%."
- "The probability of hitting between center (x=0) and side (x=31.5) is 8%"
- "The Z table describes probabilities of areas, in relationship to x distance. I need a Z table!"
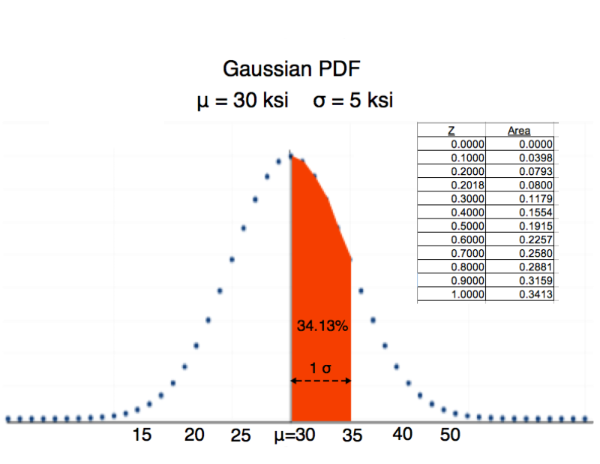
Z Table - Caution: It is centered around 30, not 0 as usual!
Figure 3
- "Whenever I have a Z table, I always use formula: z = (x-μ)/σ"
- "From the Z table, we know that Probability = 8% means Z = .2018 Its in Figure 3!
- "But Figure 2 shows that Gauss PDF is centered. That means μ = 0
"
- "So I will plug in values into Z formula: z = (x- μ)/σ where μ=0 and Z=.2018"
- " .2018 = (x - 0)/σ but I can see x is 31.5 feet (look at Figure 2)"
- " .2018= 31.5/σ; Now, solve for σ . Turns out σ is 156 feet"
- "OK. I know σ . What good is it? What do I want to know? For U.S Navy planes, can I calculate it with what I know??????"
"I would really like to be able to compare U.S. to Japanese dive bombers. I would like to compare those to British and German dive bombers. From other historical research, I already know the 'average miss distance' from pre-WWII British tests. Now, I need to calculate a number that is similar to the 'average miss' for U.S. dive bombers. There are two values that might do.
- The arithmetic average (the mean) for bomb miss distances. This would be perfect but is a bit harder to compute.
- Second Best is the miss radius that just captures 50% of bombs dropped. This is slightly different, but much easier to compute.
The Second Best is easier. I will do that now.
Note: 'Miss' has two meanings in this article. Usually, 'miss' refers to whether or not a bomb actually hit a ship. But 'miss distance' generally refers to the distance away from exact center of aim, that the bomb fell. In the material that follows, we are generally discussing the the second meaning. To emphasize the difference, a ship is about 63 feet wide. A bomb with a 'miss distance' of 20 or 30 feet would actually hit the ship.
If 25% of the bombs fell a certain distance to the right of center in Figure 2. And 25% fell the same distance to the left, then that distance right/or left should capture 50% of bombs dropped. So, here I go:"
- "μ = 0 σ = 156 feet Find the distance to the right that will trap 25% of bombs."
- "Refer to Figure 3. What is Z value corresponding to 25% probability. About .7 Right?"
- "Now z=(x-μ)/σ -> .7 = x / 156 -> solve for x -> 109.2 feet "
- "A miss radius of 109.2 feet will capture exactly half of bombs dropped by U.S. Navy WWII dive bombers. This is not exactly the same as the 'average miss distance' but it will be close."
The historian has now found a number that makes sense to all of us. For attacks by U.S. divebombers, 50% of the bombs will hit within a 109 foot radius of the aiming point. This is slightly different from the 'average miss distance' but will be close. He can compare 109 feet to the average miss of British, Germans, Japanese and whoever else. With a little bit more effort, the historian can compute the average miss distance, and the method is described below.
The historian started with a mess of information, but through statistics, the he was able to make sense out of the data.
Conclusion: Approach to Problem Solving
At this point, the reader may be bewildered. Often, with statistics problems, you have to sketch some pictures (like Figures 1 and 2), erase the sketches and start over. The sketches are the key to understanding the problem. Next, you mess around with the famous Z equation and try to understand how it fits in with your sketches. Then, you will try to work the problem. You may have to go 'back and forth' between the Z equation and your sketches several times before you have your final answer. That is what the historian did in the example above.
If you believe the Gaussian reasonably represents the phenomina and you have μ and σ , you can probably compute whatever you want to know.
Future Work: We have an answer we can compare to average miss distance, but it is not exactly the same. We have a model that seems reasonable for bomb targeting errors of U.S. dive bombers. We assume bomb targeting errors are Gaussian, centered on the middle of the target with average μ = 0 with a standard deviation σ = 155 feet.
- The next step in computing actual average miss is to divide the region from ship center, out to about x=300 feet into 5 or more zones (i.e. we need to go out to about 2 σ ). For each zone, we use the Z Table to compute the probability of a bomb falling within that zone.
- We need to do the following on a computer spreadsheet. What follows is a detailed procedure to add up all the 'miss distances' for each of 100 bombs. Then we divide by the number of bombs (100) to get the average. We proceed as follows:
- Assume some number of bomb drops -- 100 is convenient. The number of bombs hitting zone 2 would be the probability of hitting in zone 2 times 100 bombs.
- Likewise for zones 1,3,4 and 5. The distance from center of target for each of the zones is the distance from the center of the ship to the middle of that zone.
- Then, for each zone, we would multiply the number of bombs times the miss distance (i.e. if we want the average miss distance, we have to add the miss distances for all 100 bombs.)
- We do that for all zones and add up the numbers from all of the zones.
- Finally, we have to divide the result by the number of bombs, which was 100. (this effectively adds up the 'miss distance' for each of 100 bombs. The total is divided by the number of bombs) The number so derived is the average radial miss distance for U.S. dive bomber strikes in the WWII Pacific theator.
I hope this example shows you how to 'wallow' through a problem, dancing back and forth between pictures and equations until you can grind out a meaningful answer.
Optional Student Exercises:
1. Data from the 1905 Russo Japanese War shows that an underwater explosion within five feet of a ship damages a ship (i.e. it is a damaging near miss). Using data for U.S. Navy dive bombers above, what percentage of bombs dropped will be 'near misses'?
2. Japanese dive bombers from 1940 through 1942 got 18.2% hits when they attacked enemy ships. What is the Standard Deviation for the Japanese Dive Bombers? What is miss radius that captures 50% of the bomb drops? Were the Japanese pilots better or worse than the U.S. pilots, or were they about the same?
Contact the author
paul-watson@sbcglobal.net
by e-mail.
© 2020
All Rights Reserved
Paul F. Watson
Dionysus.biz Home Page