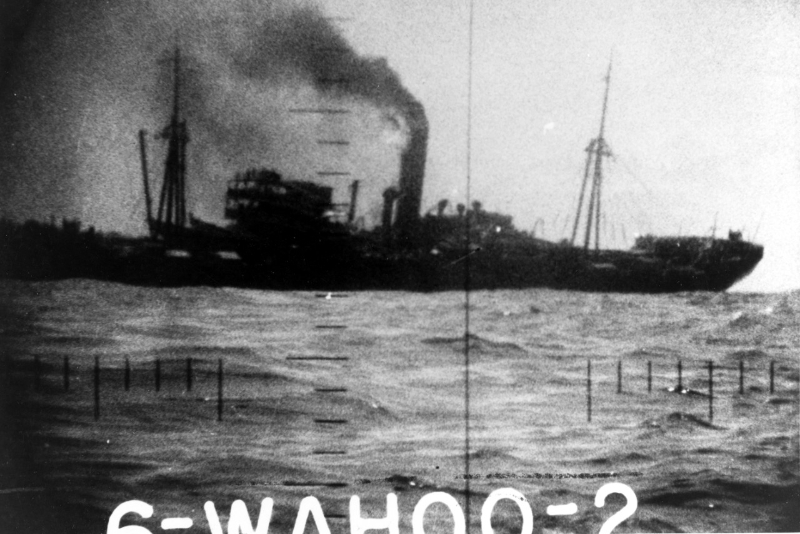
Buyo Maru, struck by U.S. Wahoo
by Paul F. Watson
January 2012
Introduction: Growing up, I saw many games which tried to emulate submarine warfare as it was fought in the opening stages of World War II. As an adult, I began to wonder how accurate those historical submarines were and how US, German and British submarines compared. This brief paper was produced to answer some of these questions.
The Torpedo Problem: The typical firing range for a U.S. Submarine in the Pacific War was 1700 yards or a mile. The U.S. Mark 14 torpedo was usually set at 45 kts and the typical target was a merchant ship traveling at 10 to 12 kts. Using these values, we may compute a torpedo run of about 80 seconds before the target was reached. During that 80 seconds, the 12 kt. target would have traveled 460 yards (1400 feet). If the torpedo was fired exactly amidships, the target would thus move out of harms way well before the torpedo reached it. This simple example accurately portrays the targeting problem. To be effective, submarines had anticipate the target’s future location.
The common firing range for U.S. submarines was between 600 and 2500 yards. Limited data suggests Japanese and British submarines fired at similar ranges. WWII German doctrine called for torpedo firing from 600 yards but scanty evidence suggests they fired at greater ranges.
Torpedo Fire Control: During the 1930’s, nations developed various “slide rule” like devices to enable submarine commanders to predict the aiming point for moving targets. In the U.S. Navy, one such device was commonly called the “banjo” based on its general appearance. Another was similar to a circular slide rule and called the “is was”. By the start of WWII, the U.S., Germany, Japan and Great Britain had developed electronic fire control computers that provided faster and more reliable solutions, although, devices similar to the “banjo” were still sometimes used in the U.S. and other navies. The technical capabilities of these instruments varied by nation with the British device somewhat less capable and the German more so.
Regardless of the fire control system used, the following inputs were required in order to solve for a firing track (aiming point): target range, speed and course.
Target Range: During the early to mid WWII, range was usually estimated from the angle between target waterline and target mast head as shown in Figure 1. Angle Theta was measured through the periscope. Then, to compute range, the sub commander had to “guess” the mast head height (~100 feet) and perform a simple calculation (see Appendix A). Alternatively, a single sonar “ping” could be used to measure range, but at risk of alerting the target.
Target speed: was estimated either visually from the “bow wave” or based on propeller RPM count observed by the the sub’s sound man.
Target course relative to the submarine was estimated visually by periscope. Small models were provided to submariners to practice this skill.
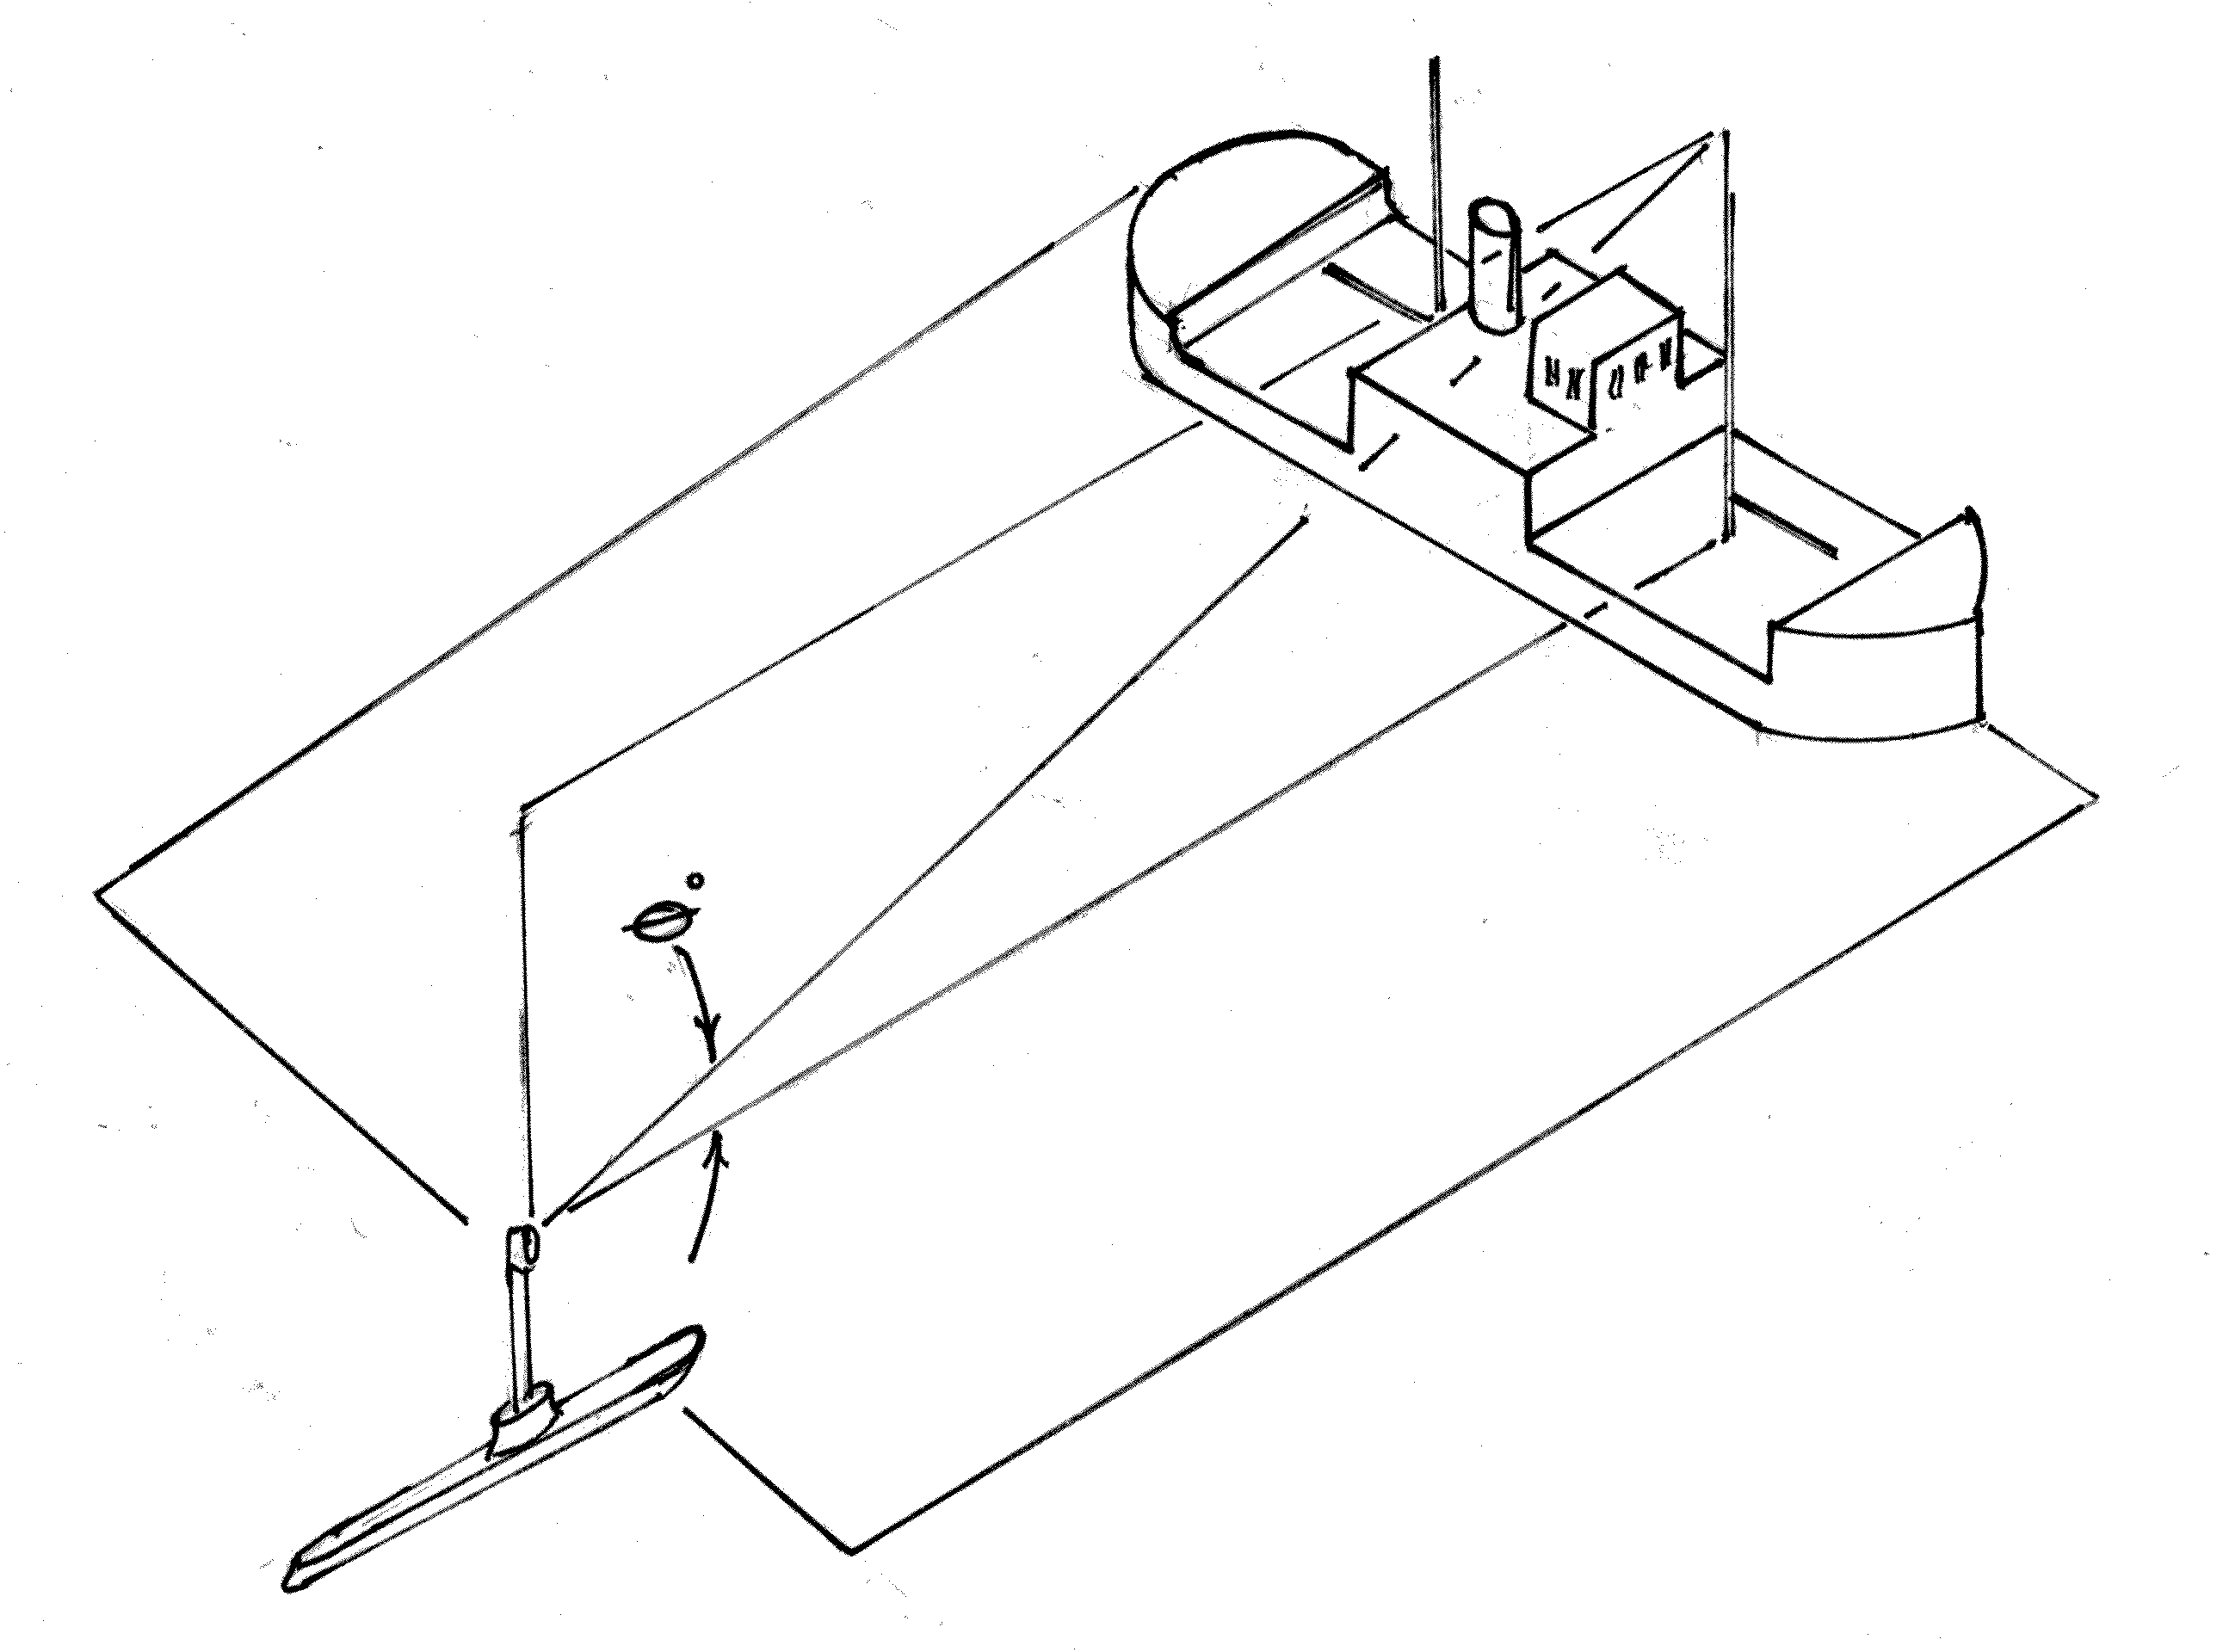
Range ft = (Mast Height ft x 57.3)/ (Theta Degrees) see Appendix A
Figure 1- Periscope Estimated Target Range
Errors in any of the above resulted in mis-prediction of the ideal aiming point. Because ships in a war zone typically zig-zag every few minutes, submarine crews had little time to make their observations and determine an aiming point. As a result, errors were common and targets were missed.
Mathematical analysis indicates the aiming point calculation was most susceptible to errors in either range or target speed (i.e. target course errors did not significantly effect the aiming point).
Historical accounts suggest range errors of 25% occurred and resulted in misses.
Merchant ships traveled between 8 and 12 kts. A competent submarine observer should be able to estimate within this range. For naval ships a wider range of speeds complicated the problem.
Torpedo Spreads: Submarines generally fired a spread of 2 to 4 torpedoes typically spread 250 feet apart or about half of the target’s length. A torpedo spread almost guaranteed the waste of one torpedo; but, it was hoped that the spread would compensate for errors in the targeting solution and hopefully ensure one or two hits. For the U.S. Navy, reality diverged from theory and good submarine commanders only achieved about 35% hits based on total number of torpedoes fired. The very best U.S. commanders achieved 50% hits. It is believed the British and Japanese submarines achieved greater accuracy than American submarines.
Periscopes and Other Aiming Devices: Submarine movies invariably show the commander standing at the periscope as he launches an attack. In the U.S. Navy prior to WWII, this type of attack was strongly discouraged because it was justifiably believed destroyers using Sonar technology should be able to find and destroy submarines that used this attack method.
Prewar British studies predicted that 75% of submerged submarines attempting to penetrate an escort sonar screen would be located and 50% would subsequently be sunk. During the first year of wartime experience, the British navy sunk 60% of attacking U-Boats, thus confirming the expectation (1).
Based on such dire predictions, the U.S. Navy trained submarine commanders to aim torpedos based on sonar bearings rather than by periscope. In early WWII, this method proved ineffective. Late tactical disposition, commander timidity and sonar based aiming rendered U.S. submarine defense of the Philippines ineffective. As the war progressed, periscope tactics were revived by commanders Warder, Dykers, Dealey and others. Survival of attacking submarines was enabled by lethargic Japanese escort ships response. While Japanese escorts were often sonar equipped, they lacked aggressive. Also, they also lacked robust depth charges with multiple depth settings.
In the Atlantic, and after heavy losses, German U-Boats began using surface night attacks by massed U-Boats. German successes encouraged the U.S. to try night surface attacks in 1943. This method proved advantageous as the surfaced submarine was faster than the convoy.
Surface search radar suitable for locating ships at night was installed in U.S. submarines by mid 1943. While intended as a target location tool, it was capable of measuring target bearing angle and was sometimes used with success to aim torpedos. By late 1944, the U.S. began installing “in periscope” radar with range finding capability. This equipment should have eliminated the primary source of inaccurate firing solutions and yet, the hit percentage did not improve.
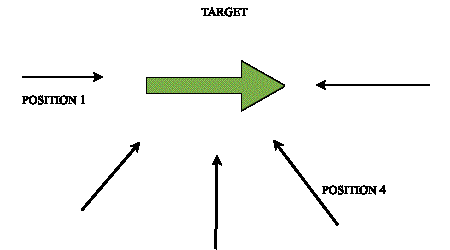
Figure 2, Attack Positions
Types of Attack & Firing Solutions: Figure 2 shows five possible submarine attack positions relative to a target ship. Position 3 (directly off the beam of the target) was considered the ideal attack position. Positions 2 & 4 were thought acceptable while 1 & 5 were not. (From position 1, a merchant ship’s apparent width was about 35 feet. When viewed from the beam, the merchant ship’s target width was typically 500 feet.)
While positions 1 and 5 were not considered ideal, they did have one clear advantage. When a target was headed directly toward or directly away from a submarine, it was not necessary to compute “where the target would be” 41 seconds later. When headed directly away, it would be directly down the same “firing alley” and the sub commander would merely wait a few seconds longer before the torpedo (hopefully) hit. Aware of this, Commander Dudley Morton (and others) sometimes fired at charging destroyers by simply pointing the periscope crosshairs at the target and firing. While Morton successfully destroyed attacking destroyers in this fashion; careful probability study indicates it was not a safe gamble.
Causes of Torpedo Firing Solution Errors: Torpedo accuracy (i.e. the percentage of hits that can be expected as a function of range) depends on the design capability of the torpedo, the firing system and also on skill of the submarine crew.
The inherent capability of a torpedo is dependent on:
Precision of angle control. (i.e. how closely will a torpedo conform to its intended path)
Precision of depth control (must travel at assigned depth)
Dependability of firing mechanism (but explode on reaching the target)
Angle Control: Statistical studies based on position 1 and 5 attack positions indicate that 67% of torpedoes traveled between 1/2 degree left and 1/2 degree right of their intended aiming point. In engineering terms, we would say that the WWII U.S. torpedo had a normally distributed firing angle with a standard deviation of about 1/2 degree. This assumes the submarine was aligned with intended torpedo path at the moment of firing (i.e. minimum gyro angle). In general, we may conclude that U.S. torpedoes were sufficiently capable. It appears that German, British and Japanese torpedoes were likewise capable.
Depth Control: Torpedo success also depends on depth control, as many failures resulted from torpedoes running underneath intended targets without exploding. The US Mark 14 torpedoes (and those of other nations) were equipped with depth measuring/regulating devices and could be set to “run” at any desired depth. During the early war period, the Mark XIV design had an uncorrected design defect that caused torpedoes to “run” about 11 feet deeper than they were set. As a result, many early war torpedoes “ran” far below intended victims, thus defeating magnetic proximity detonators. The depth control design defect was corrected in late 1943. Early war German torpedoes had similar depth control issues, but Germans solved these problems within one year.
Firing Mechanism Dependability: Two issues existed with early war U.S. Mark XIV firing mechanisms. Early war U.S. torpedoes were equipped with duel exploders, a magnetic proximity device and a contact device. Both had problems. In the previous paragraph, failure of the magnetic detonator as a result of depth control issues was discussed. But in addition, the magnetic exploder itself was not dependable. Sometimes it fired prematurely and sometimes did not fire at all. In early WWII, both the British and Germans had similar problems and both discontinued their use of magnetic exploders after one year of war experience. The U.S. did not discontinue use until late 1943.
For the U.S., the contact exploder also had a design issue. Firing pin weight and surface friction, combined with its transverse orientation often resulted in failure when a high speed torpedo struck near normal to the target (i.e. the intended situation). About 50% of torpedoes fired at 45 kts. striking within 45 degrees of normal to the target failed to explode due to impact distortion of firing pin guide rails. This defect was corrected circa 1943. Once again, early WWII German torpedoes had similar problems and these were corrected by copying captured British torpedos.
For these and other reasons, about 1.4% of U.S. early war torpedoes exploded prematurely before reaching the target (due to sensitivity of magnetic exploders). About 1.4% ran erratically, thereby wholly missing the target. Another 5% were observed to strike the target but did not explode (2). In addition, a very high percentage of U.S. torpedoes passed very deep under the target.
Crew Skill: Human factors seem to have had the greatest effect on achieved percent hit rates. Superb torpedo men like Tommy Dykers of Jack, achieved close to 50% hits at ranges varying from 800 to 3000 yards, but it appears most other commanders lacked his skill.
The author performed a study of torpedo effectiveness based on extracted data from official war Patrol Reports. The study mostly selected successful submarines and followed them through their careers. As a result, the hit percentages determined likely exceed typical for the U.S. Navy. The study included many prolonged attacks that resulted in the firing of 408 torpedoes and achieved 159 hits for 65 ships sunk (which includes both merchant and naval).
These numbers indicates about 6.9 torpedos fired for every ship sunk. If adjusted for the 30% optimism of patrol reports, then about 9.2 torpedos were fired for every ship sunk based on research performed by Watson on 408 torpedo firings. The usual and comparable reported figure for U.S. Pacific submarines is about 11 fired per sinking.
Given that the average ship was sunk with about 1.8 torpedos, where did the others go? About 1.5 of them struck and damaged ships which failed to sink. And the remaining torpedos missed targets due to crew errors or target evasive action.
The table below summarizes results of the Watson study of data extracted from patrol reports.
| Fired | Hits | Duds | Erratic | Early | Sinkings |
|---|---|---|---|---|---|
| 408 | 159 | 8 | 11 | 10 | 65 Total |
| 100% | 38.9% | 5% | 2.7% | 2.5% | n/a |
While the current study is focused on hit percentages, a companion study (also by Watson) evaluated the number of torpedo hits required to sink ships and the average number of hits withstood by damaged ships. Some of those results were required to prepare Table 2 below.
Table 2 presents torpedo hit percentages by year. While most of the entries in Table 2 are directly from source 2, some are not as indicted by “Est” in the table. See Appendix B for computation.
| Year | Fired | Claimed Snk | JANACSnk | Hit%(1) | Source | |
|---|---|---|---|---|---|---|
| 1942 | 1442 | 274(240) | 180 | 44% est | Blair 359 | |
| 1943 | 3837 | 443 | 335 | 28.9% est | Blair 551,552 | |
| 1944 | 6092 | 849 | 603 | 35.9% est | Blair 816,818 | |
| 1945 | 3277 | ~160 | ~125 | 12-18% est | Connell | |
| Total | 14748 | 1827 | 1314 | 30% est | Blair 877,878 |
A 1942 claim of 240 sinkings would be consistent other year’s claims relative to JANAC
Examining of Table 2 strongly suggests that the hit rate did not improve during the war, but decreased instead. This is rather surprising in light of the three major technical defects which plagued early war combat patrols.
44% hits in 1942 far exceeds what was achieved in later years. Despite torpedo defects, commanders Dykers, Morton, Dealey and others hit consistently. Their repeated success suggests equipment capability was sufficient. Thus, training and shooter skill are indicated. It also appears that British and Japanese commanders did better than U.S. Commanders suggesting better was achievable.
It is likely that the constantly expanding size of the submarine force and consequent large number of personal transfers between U.S. boats defeated the expected learning curve. It is also plausible that “non aggressive” commanders who were replaced during 1942 were far more capable than the men who replaced them.
Torpedo Success Statistics by Commander:
Methodology: A set of historical data was extracted from official combat patrol reports (Ref 3). The data represents numerous commanders who served on four boats. Roughly 408 firings were extracted and characterized by boat for range, spread, hits, target type etc.. This data set was then analyzed and the results are presented in a number of ways as follows.
Commander Hit Percentages: Table 3 below compares commanders in terms of total torpedos fired against total hits and average range.
| Cmdr | Boat | Tot Fired | Tot Hits | Hit% | AvgYds |
|---|---|---|---|---|---|
| Dykers | Jack | 57 | 26 | 46% | 2600 |
| Dealey | Harder | 41 | 94 | 44% | 1550 |
| Morto | Wahoo | 72 | 27 | 38% | 1475 |
| Kennedy | Wahoo | 14 | 6 | 43% | 1625 |
| Ferrall | SeaDragon | 38 | 7 | 18% | 1350 |
| Rutter | SeaDragon | 62 | 25 | 40% | 1700 |
| Ashley | SeaDragon | 34 | 9 | 26% | 1400 |
| Krapf | Jack | 37 | 18 | 49% | 2500 |
Table 3
Range Effects on percent Hits: In order to characterize the effects of range on hit percentage, torpedo firing events were grouped by range "buckets". The quantity in each "range bucket" by commander was then grouped to form Table 4 below.
| RangeYd | Bucket | Dykers | Krapf | Morton | Dealey | Ferrall | Rutters | Ashley | Kennedy |
| 600-899 | 750 | - | - | - | 66% | 33% | 57% | 25% | 57% |
| 900-1199 | 1050 | 50% | - | 42% | 37% | - | 40% | 36% | - |
| 1200-1499 | 1350 | 50% | 0% | 40% | 50% | 14% | 22% | 0% | - |
| 1500-1799 | 1650 | 29% | 50% | 33% | 13% | 17% | 60% | - | - |
| 1800-2099 | 1950 | - | 50% | 0% | 38% | 0% | 18% | 33% | 25% |
| 2100-2399 | 2450 | - | 50% | 25% | 50% | 50% | 50% | 60% | - |
| 2400-2699 | 2550 | 60% | 75% | 0% | 33% | 50% | 63% | 0% | - |
| 2700-3000 | 2850 | - | 33% | - | 50% | 0% | - | - | 33% |
| >3000 | 3000 | 48% | 44% | 23% | 41% | 21% | 44% | 24% | 38% |
Table 4
The contents of Table 4 were graphed below to facilitate visual interpretation. Data points for each commander as distinguishable by color as shown at right of Figure 3.
Hit Percentage by Commander (Mostly Beam Angle Firings for table above & graph below
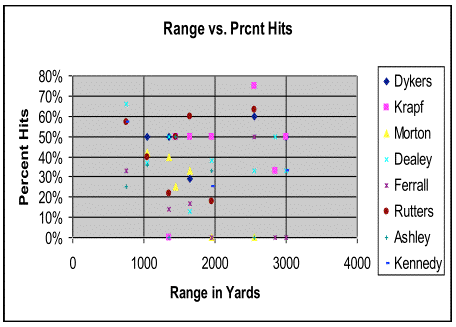
Figure 3, Hit Percentage by Commander at Range in Yards
Taking all data points together, no trend is evident in Figure 3. But by examining data discretely by commander, trends become distinguishable. The blue diamonds representing Tommy Dykers are generally above most other data points indicating superior skill in torpedo accuracy. Art Krapf’s data shows likewise. Ferrall’s data points are at bottom suggest lackluster performance.
Further examination of the data by commander suggests:
While greater quantity of data might help to clarify trending, a different approach was taken. Data smoothing techniques were applied to the global range dependent data set with the following results:
| RngYd | Hit% | Smoothed | RngYd | Smoothed |
| 500 | 65.0% | - | - | - |
| 750 | 51.0% | 49.7% | 750 | 49.7% |
| 1050 | 33.0% | 39.0% | 1050 | 39.0% |
| 1350 | 33.0% | 32.2% | 1350 | 32.2% |
| 1650 | 30.5% | 30.3% | 1650 | 30.3% |
| 1950 | 27.3% | 37.6% | 1950 | 37.6% |
| 2250 | 55.0% | 44.1% | 2250 | 44.1% |
| 2550 | 50.0% | 40.0% | 2550 | 40.0% |
| 2850 | 15.0% | 30.0% | 2850 | 30.0% |
| 3130 | 25.0% | 13.3% | 3130 | 13.3% |
The far left column identifies the “range buckets” that were considered. The second column indicates the smoothed data (which was created by applying averaging techniques. The far right two columns echo columns 1 and 3 to facilitate graphing.)
Data from the far right two columns was then plotted as the pink mid line of Figure 4 below may be viewed as having historical significance as it correlates to smoothed historical data.
The yellow curve of Figure 4 is a speculative representation of the range accuracy dependency for a highly skilled marksman. The bottom blue curve is likewise a speculative representation for a mediocre performer. It may be observed that use of the yellow curve at 2600 yards and use of the blue curve at 1350 yards closely approximate hit percentages of Dykers and Farrell respectively as shown in Table 3.
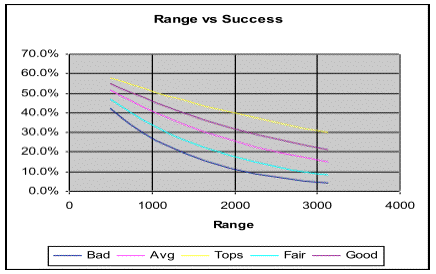
Figure 4 - Beam Angle Success Rates (Range in Yards)
The raw data presented in Table 5 is difficult to interpret. The purpose of Figure 4 is to show hit percentage trends revealed by data smoothing and regression analysis for commanders of varying skill levels.
Target Variables:
Off Beam Target Angle Effect: During WWII, submarine commanders considered firing off the beam as ideal (i.e. position 3 in Figure 2). As the off-beam angle moves away from position 3 of Figure 2, two effects are manifest.
The target is “foreshortened”. That means the “apparent target width” becomes less. At positions 2 and 4, “apparent target width” is 70% of position 3 (Sin[45 degrees]=.707).
As firing position approaches positions 1 and 5, the “aiming point” becomes a direct line to the target. Consequently, careful calculation of an aiming point is not needed.
Target Velocity Effect: The inherent torpedo and aiming system was good enough to ensure hits at 2000 or 3000 yards. The Target Data Computer was very capable of computing the “aiming point”. Thus, misses were either under the target, else were caused by errors in estimating target range and speed. Errors in both are magnified by the speed of the target.
Day vs. Night Effects: Historical data serving as a basis for this study indicates night accuracy of 41% at an average of 2035 yards but only 38% for an average of 1512 yards during daytime firings. When range adjustments are taken into account, night attacks were considerably more likely to hit than day attacks for similar conditions.
Effects of Triple Torpedo Spreads: An average commander historically achieved about 30% hits at typical firing ranges of 1500 to 1700 yards. Most of these attacks involved firing a spread of 3 (sometimes 2 or 4) torpedoes. Given that American firings resulted in about 30% hits, a mathematical study of the effect of spread firing becomes possible (such a study is underway at this time). Based on “as yet unpublished results”, the probability per torpedo of hitting based on triads vs. single fired torpedos at a typical range of 1750 yards is:
Triad Spread probability of each striking target = TBD1
Single fired probability of striking target = TBD2
Foot Notes:
* Submarine Operational Effectiveness in the 20th Century Part 2, by Capt. John F. O’Connell, USN (Ret)
* Silent Victory by Clay Blair Jr., Naval Institute Press, Copyright 1975
* U.S. WWII Submarine Patrol Reports- HANSA: http://www.hnsa.org/doc/subreports.htm
* Silent Running by James F. Calvert, Vice Admiral, USN (RET) copyright 1995 and published by John Wiley & Sons
* Wahoo, by Richard O'Kane, Published 1996 by Presidio Press
* British Data: http://home/cogeco.ca/sm/attack.html provided data concerning number of military vs. merchant ships sunk by British submarines during WWII. Also, photos of British targeting computer, torpedo cost data and statement that British torpedos were accurate to about 1 degree of their assigned firing angle.
* Various statistical methods. See Used Math and also Schaum’s Outline for Statistics
1942 Claimed Hit Percentage:
Depending on details of estimation methods, the computed hit rate for torpedos fired in 1942 is 44% or better. While no basis exists for refuting this number, it seems rather high. I suspect 38% to 40% is likely real for the period. Even when “derated” to 39%, performance for 1942 greatly exceeds that for any other period of the war. I believe that the U.S. practice of rotating crews on a continual basis resulted in chaos which eroded their ability to hit targets.
Example of estimation: 1943 Claim based Percent Hits
Based on Merchant Ship Vulnerability Study by Watson, 2/3 of all ships hit by torpedos sank. 1/3 did not sink. Thus the number of “damaged ships” is half the number sunk.
Based on same study, sunk ships received an average of 1.81 torpedo hits. Damaged ships received and average of 1.52 torpedo hits.
The number of hits is thus: Torpedo hits =1.81 x sunk + 1.52 x damaged
Percent hits = Torpedo hits / Torpedos fired
1943: Percent hits = [(443*1.81) + (50%*443*1.52)] / 3937 = 28.9%
1945 Estimates: Little data seems available for 1945.
Tonnage sunk per JANUS was divided by 4000 tons per vessel to arrive at number sunk.
Damaged ships computed at 50% of number sunk.
Total torpedos fired is computed by subtracting years 1942 through 1944 from war total.
The result is a very poor 12% to 18% estimate of hits. This author suspects that the war total torpedos fired (14748 per Blair) may include practice firings, may include torpedos lost in the Phillipines etc.. This researcher believes all data presented for 1945 in Table 2 is speculative.Appendix C- Range Finding Using a Periscope
From Trigonometry: Tan(Theta) = (Mast Height)/(Range) both in feet
Range = Mast height/(Tan(Theta)) algebra re-arranging
Mast height is “guessed” by the sub skipper. Usually ~ 100 feet
But Tan(Theta degrees) ~ Theta/57.3 where Theta is in degrees
So Range = [(Mast height) x 57.3]/Theta Degrees
Example: If Mast Height is estimated as 100 feet
and Theta measurement through periscope is .2 degrees
Then: Range= (100x57.3)/.2 = 28650 feet
or 9550 yards
Note: Target angle Theta shown above was measured by a device in the Periscope called a Stadiometer. For the U.S., periscopes were equipped with a knob which created a “ghost image” of the target. By turning the knob, the ghost image moved up or down relative to the “real image”. By rotating the knob until the “ghost” waterline matched the “real image” mast top, the angle was measured.
Copyright 2012 by Paul F. Watson
All Rights Reserved