Music 1: LittleTomcat (see attributions)
Music 2: Portugese Nostalgia (see attributions)
Notice: All of my work is historical- WWII and before.
Simulation Modelling for Naval Games
Preface:
The following article describes the motive and method for modelling history through equations whenever a computer game is contemplated. Put simply, a happy computer works with equations. Unhappy computers work with probability tables. This article discusses the method for converting historical data into equations. We will concentrate on naval warfare; but, the methods apply equally to land based situations. Last, the Tillamook High School computer teacher kindly shared his knowledge of modern game engines (Unity, UnReal, Godot etc.). In particular, many of these tools provide convenient curve fitting tools; but, I would encourage the developer of games to at least review such conclusions with a spreadsheet to ensure that such equations do not contain nasty surprises.
Simulation Games In Historical Context:
30 years ago, simulation games were played on game boards, with dice roles which referenced lots and lots of tables. These tables purportedly represented more or less realistic outcomes on a probability basis. Today, simulation games are typically played on computers, often engaging multiple players. I suspect that all to often, in the background a random number generator result is still compared to tables. While tables can be useful, I would like to see that changed. Computers by their nature work with equations. Most of the research I have been doing reduces historical reality to data points which are then "curve fit" via regression software thus producing an equation. Ahhh- the beauty of an equation. Defined at every point and quite naturally understood by computers. Such equations can be coded directly into software routines and time consuming disk access is avoided, as are large data tables.
Examples of Functional Descriptions:
Velocity and Angle of Fall of Cannon Shells: While it is very possible to write a computer program which performs a "step wise"
approximation of the flight of a cannon shell, such programs are typically slow. For gaming purposes, it is more useful to collect
a family of data points for a gun of given size (e.g. 11 inch German naval gun of circa 1935) and to simply make a tabular list of range vs. impact velocity. A regression analysis program can then be used to find an equation which closely fits most of the points. Once the equation is known, then the computer running the simulation game simply injects the current range into the equation and computes the resulting impact velocity. The same can be done with the angle of fall. Such solutions are much faster and cleaner than tabular listings.
Armour PenetrationWWI and WWII armour penetration models based on impact velocity of cannon shells are generally available from various sources such as Jane's Book of Fighting Ships, Various articles in Naval Journals, and the excellent publications from Naval Institute Press. If the angle of fall is known and the velocity of the shell is known, these armour penetration models are easily written in equation form and can be used to determine whether a particular shell, fired at a given range and striking armour of known thickness penetrates. An alternative approach would be to build up data from historical sources (such as "The Fighting at Jutland", and then to reduce the data to x,y tabular form suitable for curve fit analysis to determine a suitable equation.
Submarine Probability of Torpedo Hits at Various Ranges:
The avid game inventor can collect data from historical sources regarding hits and misses at various ranges. Available data is then blocked into ranges (500 to 1000 yards, 1001 to 1500 yards etc.) and the total percentage hits is computed for each of the ranges based on collected historical data. Next, a table of x,y values is made where x is the range (center point range. i.e. 500 to 1000 yards has a value of 750 yards), and y is the percentage hits. Last, a curve fit (or regression) program is used to find an equation that nearly fits the data. During such exercises, try for simple equations that are pretty good -- avoid complex equations with many terms. Once the actual game is crafted, the software code can have the determined equation "built into the code" to provide fast and historically justified results. One of my research articles already does much of this work for anyone interested in building such a game.
Probability of Dive Bomber Hits:
Sufficient data is available to model the probability of a WWII dive bomber hitting a ship of various types (See Peter Smith's book on Dive Bombers). Once the main functional dependencies are known (In WWII, bombs were usually dropped from 1200 to 1500 feet. Lower is better), x is taken as the prime determiner of hit probability and y is the probability of historical hits. A table of x,y values is made and curve fit. Finally, the equation "spit out" by the curve fit software can be used as part of the coding of the game and as a basis for comparing a randomly generated number to the probability from the function to determine if a hit was achieved.
Counter Examples of Functional Descriptions: In all cases, a curve fit solution is not the best answer. In many situations, the "x" value may not be numeric. One of my research articles on this website collects data on how many WWII torpedoes were required to sink ships of various types (i.e. freighters, tankers (full or empty), destroyers, mine layers etc.). The "X" value is apparently the type of ship, but freighters, tankers and destroyers are not numbers and do not easily reduce to numbers. We could try something like using the "Gross Tonnage" of the various types of ships and perhaps a relationship could be established; but, on the surface it looks like this is better handled with a table.
Guidelines for Curve Fitting of Data:
Curve Fitting is a "crude term" for Regression Analysis. They mean the same thing. Curve fitting takes a set of x,y data and attempts to put an equation through the points, or as closely as can be. Most curve fitting software comes with 4 or 5 general equation forms built in. The user is asked for the x,y pairs of data and is asked to choose which equation form to use. Common equation forms include the following:
Linear Equation (y = mx + b) Computer will accept your list of x,y pairs and will compute the best m & b value.
Power Law (y = a * x ^b) Computer will accept your list of x,y pairs and will compute the best a and b value.
Polynomial (y= a*x^3 + b*x^2 + c*x + d Computer will accept your x,y pairs and will compute a, b, c, d etc.
Exponential - This thing is a bit like the power law but involves the mysterious number e.
The program will usually tell you something called r^2. If R^2 is 95% or higher, you likely have a pretty good fit although it may be "ratty" at the left and right ends. If R^2 is less than 85%, you probably have a pretty bad fit.
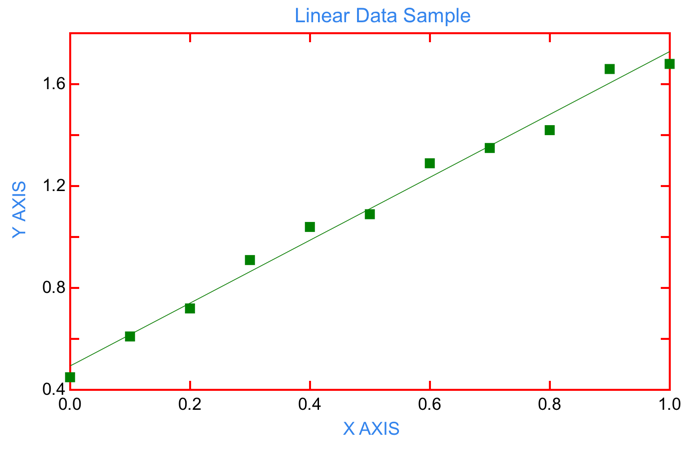
It is a good idea to use a program that not only does the curve fit, but plots out your data with the curve on top.That way, you can see if the fit is fairly good all along the data set, or if it gets really bad at the ends. The plot below was made using Scientific Data Analysis software on an I-Pad. A second sheet of display shows the equation and R^2 value.
Equation: y = 1.2345x + .4936 (i.e. m=1.2345 and b=.4936 for equation in standard form y = mx + b)
R^2 = .988
It is also a good idea to try fitting the data to 2 or 3 different equations. Then pick the one you like.
There are lots of good regression software packages available for everything from I-Pad to computer. But you likely have access to X-Cell which can do it!. The command is under Data/Trend Analysis. The Apple spreadsheet as provided for Mac has similar capabilities.
Advantages of Functional Descriptions:
Use of equations in lieu of tables results in cleaner computer code with less logic.
Use of equations in lieu of tables generally results in faster program execution.
Use of equations often allows algebraic substitution to build new equations which directly and dependably produce useful results. My article on "Anti Torpedo Defence Systems..." makes extensive use of this technique to generate some rather complex equations from simple, curve fit origins.
Reduction of "reality" to equations sometimes results in deep insight into history and technology that is not apparent without having undergone the exercise. Clearly, such insight requires considerable maturity in mathematics and interpretation there-of.
Use of equations is obviously a more moral way to code software!
Conclusion:
I have offered convincing reasons why equation form of data should be used in computer simulation games in lieu of tabular data when possible. Numerous examples of the kinds of
situations where this applies have been offered, along with an example where it does not apply. Guidelines have been provided to aid in the development of your own equations, to suit your own purposes. Wishing you the best and hoping this brings some light to your future gaming efforts,
P.S. A few words on historical research. When designing games, a great deal of reading is needed to assemble enough data to create a model that is rather like the actual historical events. Often, a single sentence from a history book is critical. For example, "Pre WWII British analysis indicated that a submarine attacking a well protected convoy was about 66% likely to be sunk by escorting ships. (this is historically true)." Several well documented German attacks against convoys proved this to be true; yet, in the Pacific theatre, U.S. submarines were rarely sunk, because "the best" Japanese commanders and crews were not doing "anti submarine warfare". The 2/3 rule applies in the Atlantic, is accurate and stands on a single quote. Contrary Pacific War experience stands on volumes of data and is the result of less than committed enemy ASW teams. Describing historical reality is always a challenging and time consuming task.
Paul Watson
Music Attributions:
"Little Tomcat" by Josh Woodward. Free download: http://joshwoodward.com/
"Portuguese Nostalgia obtained from www.jewelbeat.com as paid commercial use 2012.

 30 years ago, simulation games were played on game boards, with dice roles which referenced lots and lots of tables. These tables purportedly represented more or less realistic outcomes on a probability basis. Today, simulation games are typically played on computers, often engaging multiple players. I suspect that all to often, in the background a random number generator result is still compared to tables. While tables can be useful, I would like to see that changed. Computers by their nature work with equations. Most of the research I have been doing reduces historical reality to data points which are then "curve fit" via regression software thus producing an equation. Ahhh- the beauty of an equation. Defined at every point and quite naturally understood by computers. Such equations can be coded directly into software routines and time consuming disk access is avoided, as are large data tables.